True Product Cost™
You can’t manage what you’re measuring wrong.
Most manufacturers believe they know their product costs. The data says otherwise — and the gap between assumed cost and actual cost is where margin silently disappears.
70%
of indirect costs are misallocated under standard costing
30%
of SKUs typically account for all profitability
6%
average EBITDA uplift from accurate product costing
On demand
cost model reconfiguration as mix or processes change
The Problem
Standard costing was built for a different era of manufacturing.
Traditional cost allocation methods were designed when direct labor dominated the shop floor. Today, indirect costs — overhead, logistics, quality, administration — represent the fastest-growing share of total cost. Standard costing spreads these across products using crude averages that have no relationship to how those costs are actually incurred. The result is a distorted picture of profitability that leaders are making real decisions from.
Oversimplified assumptions distort reality
Spreading indirect costs using direct labor or machine hours misallocates expenses across products. In modern manufacturing — where indirect costs are rising rapidly — this produces skewed margins that obscure true profitability.
Static rules can’t keep pace
Fixed allocation rules fail to adapt when production methods change, product mix shifts, or resource usage evolves. Financial insights become outdated almost as soon as they’re generated.
Profitable and unprofitable products look the same
When costs are averaged across a diverse portfolio, it’s nearly impossible to identify which SKUs are driving margins — and which are silently eroding them.
No foundation for micro-level decisions
Pricing, product rationalization, and customer negotiations all require P&L clarity by product, by process, by customer. Standard costs don’t produce that resolution.
The Vayoom Approach
Attribute-based costing, built for how manufacturing actually works.
Vayoom’s True Product Cost™ algorithm replaces broad averaging with precision. Instead of allocating indirect costs through direct variables like labor or machine hours, Vayoom distributes them using the product and process attributes that actually drive each cost category.
True Product Cost™ creates accurate customer and product P&Ls. It’s not a reporting tool — it’s a decision engine.”
Controllers and operations managers configure the model by selecting the appropriate attributes for each indirect cost category — setup complexity, material handling requirements, quality inspection intensity, logistics footprint, and more. Because each product differs in how it consumes these shared resources, the resulting cost picture reflects operational reality rather than accounting convention.
Critically, the model is not static. As product mix, processes, or cost structures change, the categorization can be updated on demand — so the cost model evolves with the business rather than lagging behind it.
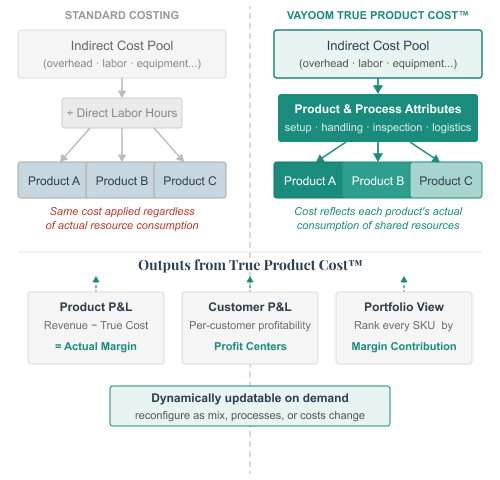
How Indirect Costs Reach Products
From Cost Clarity to Strategic Action
Cost accuracy is the input. Product stratification is the output.
Once True Product Cost™ establishes what each product actually costs to produce, Vayoom segments the full portfolio into tiers based on revenue, cost, and margin contribution. This stratification turns cost data into a decision framework — one that tells you where to invest, where to reprice, and where to rationalize. Product profits are also interconnected: production that shares equipment, materials, and labor means one product’s resource consumption affects the cost of others. True Product Cost™ captures these interdependencies rather than treating each SKU in isolation.
Tier 1
High-margin products
The products that generate disproportionate profitability. Stratification identifies them precisely so you can protect volume, strengthen pricing, and prioritize capacity accordingly.
Tier 2
Mid-tier products
Products with margin potential that requires targeted attention. Stratification reveals which cost drivers are suppressing performance and where operational improvements will move the needle.
Tier 3
Tail products
Low-contribution SKUs that consume shared resources disproportionately. Stratification surfaces the hidden cost of complexity — enabling informed rationalization decisions rather than guesswork.
What it Enables
Decisions that were previously impossible to make with confidence.
True Product Cost™ and product stratification together create a foundation for decision-making that standard costing cannot support. Each of the following depends directly on having accurate product-level cost data.
Precise Pricing
Quote and price from actual cost — not averaged estimates that erode margin at the point of sale.
Targeted Improvements
Focus operational investments where change generates real financial return.
Portfolio Rationalization
Make informed SKU decisions backed by margin data — not volume assumptions.
Customer Profitability
Understand which customer relationships are actually profitable and negotiate from clarity.
- Product and customer P&Ls generated automatically from operational data
- Attribute model configurable by controllers and operations managers — no IT dependency
- Dynamic reconfiguration on demand as mix, processes, or cost structures change
- Feeds directly into Accurate Quoting and Detailed Profit Analysis
- Targets operational improvements where they carry the highest margin impact
Profit Potential Simulation
See what closing the gap is worth — in dollars.
A no-obligation simulation of your quantified profit potential, built from your actual operational data. Not a demo. Not a pitch. A projection.
No obligation. Data-driven projections. Zero commitment.